本記事は、Shiny Advent Calendar 2018の7日目の記事です。
そして、Shiny100本ノックの第31弾です。
今回は、plotlyと組み合わせて、Shinyアプリケーションを作成してみます。
plotlyとは
plotlyとは、データ可視化ができるWebサービスです。APIが公開されており、RやPythonから利用するためのライブラリもあるので、簡単に導入することができます。plotlyには、インタラクティブに可視化したものを操作できるという特徴があります。マウスオーバーでデータの情報を表示したり、ズームしたり、図を回したりと色々な操作をすることが可能です。
そのため、Webアプリケーションを作るShinyと親和性が高く、組み合わせることでアプリの質を上げることができます。
完成アプリの紹介
完成形のアプリがこちらです。
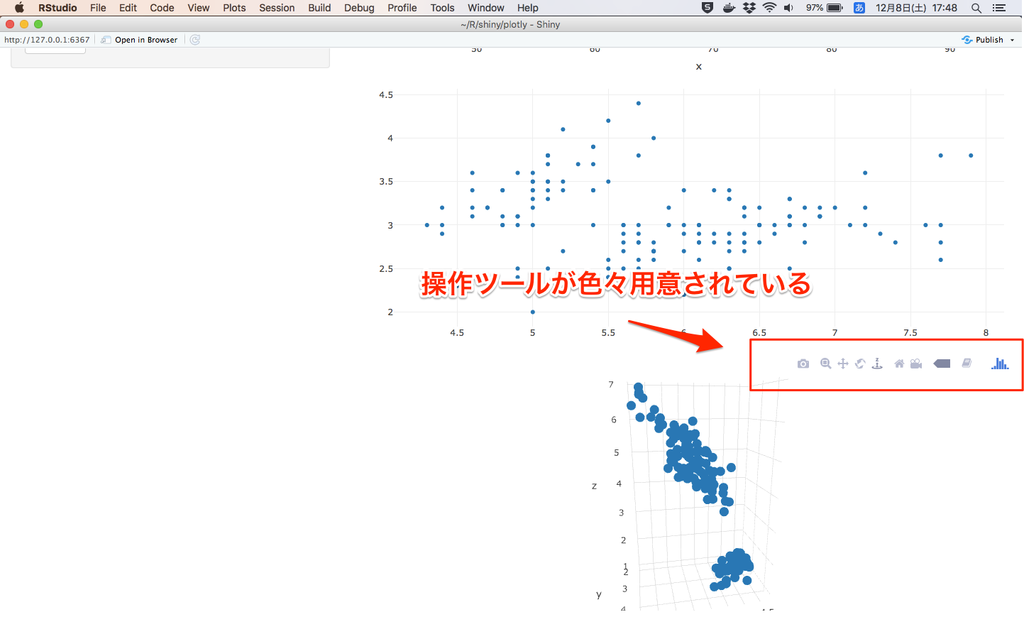
ヒストグラム、散布図、3Dプロットをplotlyを使って作成しています。plotlyで作ったプロットの特徴としては、下記のようにグラフ上にマウスオーバーすると、ズームやパンといったボタンが右上に表示されるので、それらを使ってグラフを操作できます。
あとはドラッグで範囲を選択するだけでズームできたりもするので、色々動かしてみてください。

使用しているコードの説明
コードの説明の前に、Rでplotlyを使用するにはライブラリをインストールする必要があるので、まだインストールしていない方は先にしておきましょう。
install.packages("plotly", dependencies = TRUE)全コードが以下になります。
それほどコードが長くないので、app.Rの一つのファイルで作成しています。
app.R
library(shiny)
library(plotly)

ui <- fluidPage(

  titlePanel("Old Faithful Geyser Data"),

  sidebarLayout(
    sidebarPanel(
      sliderInput("bins",
                  "Number of bins:",
                  min = 1,
                  max = 50,
                  value = 30),

      selectInput("x_var",
                  "x axis",
                  choices = c("sepal.length" = 1,
                              "sepal.width" = 2,
                              "petal.length" = 3,
                              "petal.width" = 4)),
      selectInput("y_var",
                  "y axis",
                  choices = c("sepal.length" = 1,
                              "sepal.width" = 2,
                              "petal.length" = 3,
                              "petal.width" = 4)),

    selectInput("z_var",
                "z axis",
                choices = c("sepal.length" = 1,
                            "sepal.width" = 2,
                            "petal.length" = 3,
                            "petal.width" = 4)),
    actionButton("d3","do 3dplot")

  ),

    mainPanel(
      plotlyOutput("distPlot")
      ,plotlyOutput("scatterPlot")
      ,plotlyOutput("d3Plot")
    )
  )
)


server <- function(input, output) {

  output$distPlot <- renderPlotly({

    x    <- faithful[, 2]
    bins <- list(start=min(x), end=max(x), size=(max(x)-min(x)) / input$bins)
    p <- plot_ly(x = ~x, xbins = bins,  type = "histogram")
  })

  output$scatterPlot <- renderPlotly({
    p <- plot_ly(data=iris, x = iris[,as.integer(input$x_var)], y = iris[,as.integer(input$y_var)])
  })

  output$d3Plot <- renderPlotly({
    input$d3
    p <- plot_ly(data=iris, x = iris[,as.integer(isolate(input$x_var))], y = iris[,as.integer(isolate(input$y_var))],
                 z = iris[,as.integer(isolate(input$z_var))], type = "scatter3d")
    })
}

shinyApp(ui, server)
plotlyを使う場合は、UI側でplotlyOutput()を使い、server側でrenderPlotly()を使います。通常のShinyアプリケーションでplotOutputとrenderPlotを使っているところを、plotly専用の関数に変更するだけです。
plotlyのグラフを作成するには、以下のように書きます。
plot_ly(data, x,軸 y軸, type='可視化したいグラフを選択')
グラフを生成するのにplot_ly関数を使用します。引数の例として、データの選択、軸の選択、そしてtype引数でヒストグラムや散布図といったグラフの選択をします。引数は、グラフのタイプによって変わるので、注意してください。
ちなみに、plotlyの公式ページでShinyの使い方やサンプルアプリが沢山紹介されているので、ご興味ある方は参考にしてみましょう。
plot.ly